Existing Conditions
Health is not merely the absence of illness. It is determined by how we live, work, learn and play, not just how often we visit the doctor. A healthy community is one with physical and social environments that make healthy choices the easy choices. In recent decades, we have built physical activity out of our lives and environments. Our transportation system is a major part of the physical environment, and it currently poses barriers to better health in North Carolina.
Reasons for Action
North Carolinians' health outcomes are largely impacted by chronic diseases like cancer, heart disease, stroke and diabetes. Three important health behaviors – physical activity, nutrition and tobacco – help determine our health outcomes throughout life. Obesity and overweight, which are mainly caused by consuming too many calories and expending too little energy, are increasing problems in our state. We are in the midst of an epidemic of obesity. The rate of obesity in North Carolina has more than doubled from 13% in 1990 to 28.6% in 2010(1). If current trends persist, an estimated 58% of North Carolina adults will be obese by 2030. By continuing on this trajectory, the number of chronic physical conditions would increase dramatically, including heart disease, arthritis and diabetes. But you cannot solely blame individuals for this epidemic if the environment they live in does not make physical activity options accessible. It is hard to imagine the added human toll and economic burdens to North Carolina residents, families, insurers and governments.
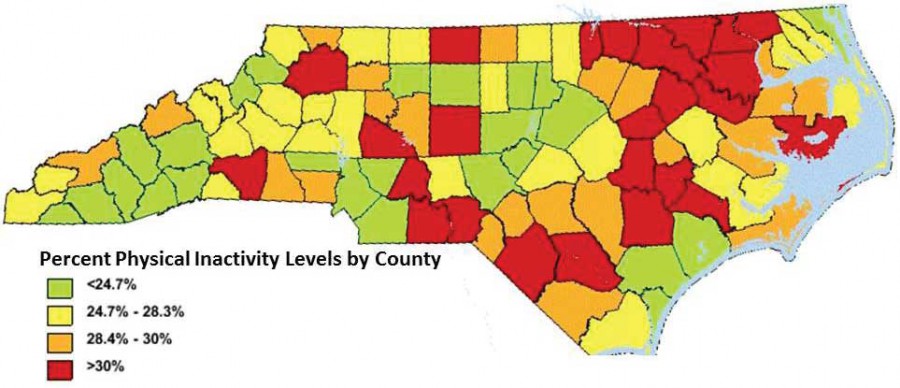
Percentage of NC adults who are physically inactive by county (2009)
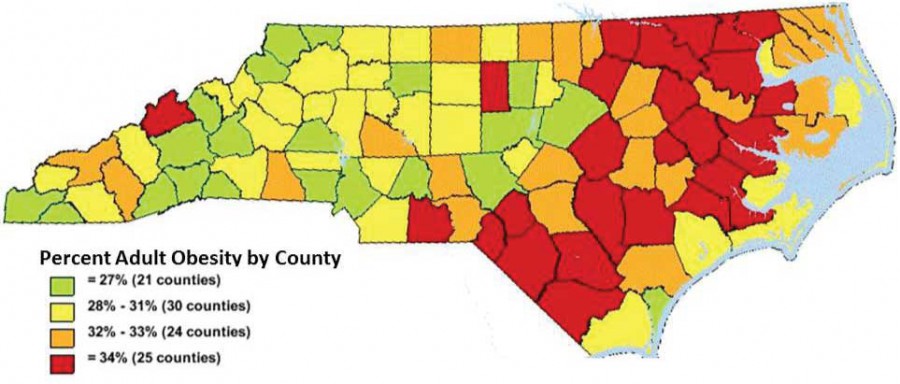
Percentage of NC adults who are obese by county (2009)
The Financial Cost of Physical Inactivity in North Carolina
Most of us have lost loved ones to chronic disease, and/or we live with these conditions within our families. The human burden of pain and suffering is clear. What is increasingly obvious is the financial burden from chronic diseases. Recent reports have estimated the annual direct medical cost of physical inactivity in North Carolina at $3.67 billion, plus an additional $4.71 billion in lost productivity(2). While these financial figures are bleak, researchers have found that every dollar invested in accessible pedestrian and bicycle trails can result in a savings of nearly $3 in direct medical expenses(3). Also, the more people spend on health care, the less they have for other expenditures, impacting the economy negatively.
Of North Carolinians surveyed, 60% would increase their level of physical activity if they had better access to sidewalks and trails(5).
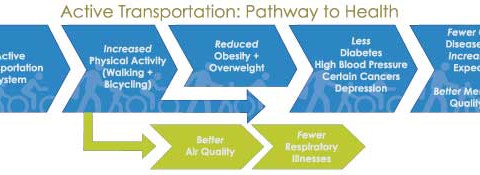
Better Health through Active Transportation
The good news is that we can stop or reverse the trend towards higher disease rates in North Carolina. Regular physical activity is one of the simplest solutions to give ourselves a longer, healthier life. Increasing one's level of physical activity reduces the risk and impact of cardiovascular disease, diabetes, and some cancers. It also helps to control weight, improves mood, and reduces the risk of premature death(4). Furthermore, regardless of one's weight, regular physical activity delays the onset and reduces the likelihood of developing chronic diseases. Children and adults can lead measurably healthier lives by incorporating 30 or more minutes of activity each day. Using active transportation to and from school, work, parks, restaurants, stores and other routine destinations is one of the best things we can do to prevent chronic diseases.
The Charlotte 'Light Rail' study found that residents who switched to walking to and commuting by light rail weighed an average of 61/2 pounds less than those who continued to drive to work(8)
Health professionals and advocates have become new partners in promoting and planning for active transportation. After carefully considering the best science and converging evidence, public health authorities, including the Centers for Disease Control and Prevention and the Institute of Medicine, have recommended road improvements, connectivity, land use policies, active transportation to schools, and programs to advance walking and bicycling(6,7).
In addition, a Health Impact Assessment (HIA) was completed as part of WalkBikeNC which reviewed three settings in North Carolina – Raleigh (urban), Winterville (suburban), and Sparta (rural). The HIA found that significant positive impacts to resident's health would occur with the addition of planned pedestrian infrastructure.
Health Impact Assessment Predicted Impacts Following Pedestrian Project Completion
| Raleigh | Winterville | Sparta | |
|---|---|---|---|
| Percent Change in Total Sidewalk Length | +388% | +360% | N/A |
| Change in Pedestrian Environment Factor | N/A | N/A | Low to Medium |
| Walking for Transportation (150+ min per week) | +7.1% | +2.3% | +1.4% |
| No Walking for Transportation | -2.5% | -0.9% | -8.8% |
| Health Care Dollars Saved at 20 Years | $25.6 million | $9 million | $13 million |
| Health Care Dollars Saved at 40 Years | $36.3 million | $12.6 million | $15 million |
| Benefit-to-Cost Ratio at 20 Years | 6:1 | 0.8:1 | 19:1 |
| Benefit-to-Cost Ratio at 40 Years | 9:1 | 1.1:1 | 22:1 |


